Understanding a number on my own RRSP statement.
A calculator for projecting investment growth across multiple accounts — built because I wanted to know exactly how my bank arrived at the number on my own statement.
A chart with no explanation.
My RRSP statement shows a bar chart projecting retirement income — one confident number, no visibility into how it was calculated or what happens if the assumptions change. Rather than reverse-engineer a static PDF, I built the calculator myself.
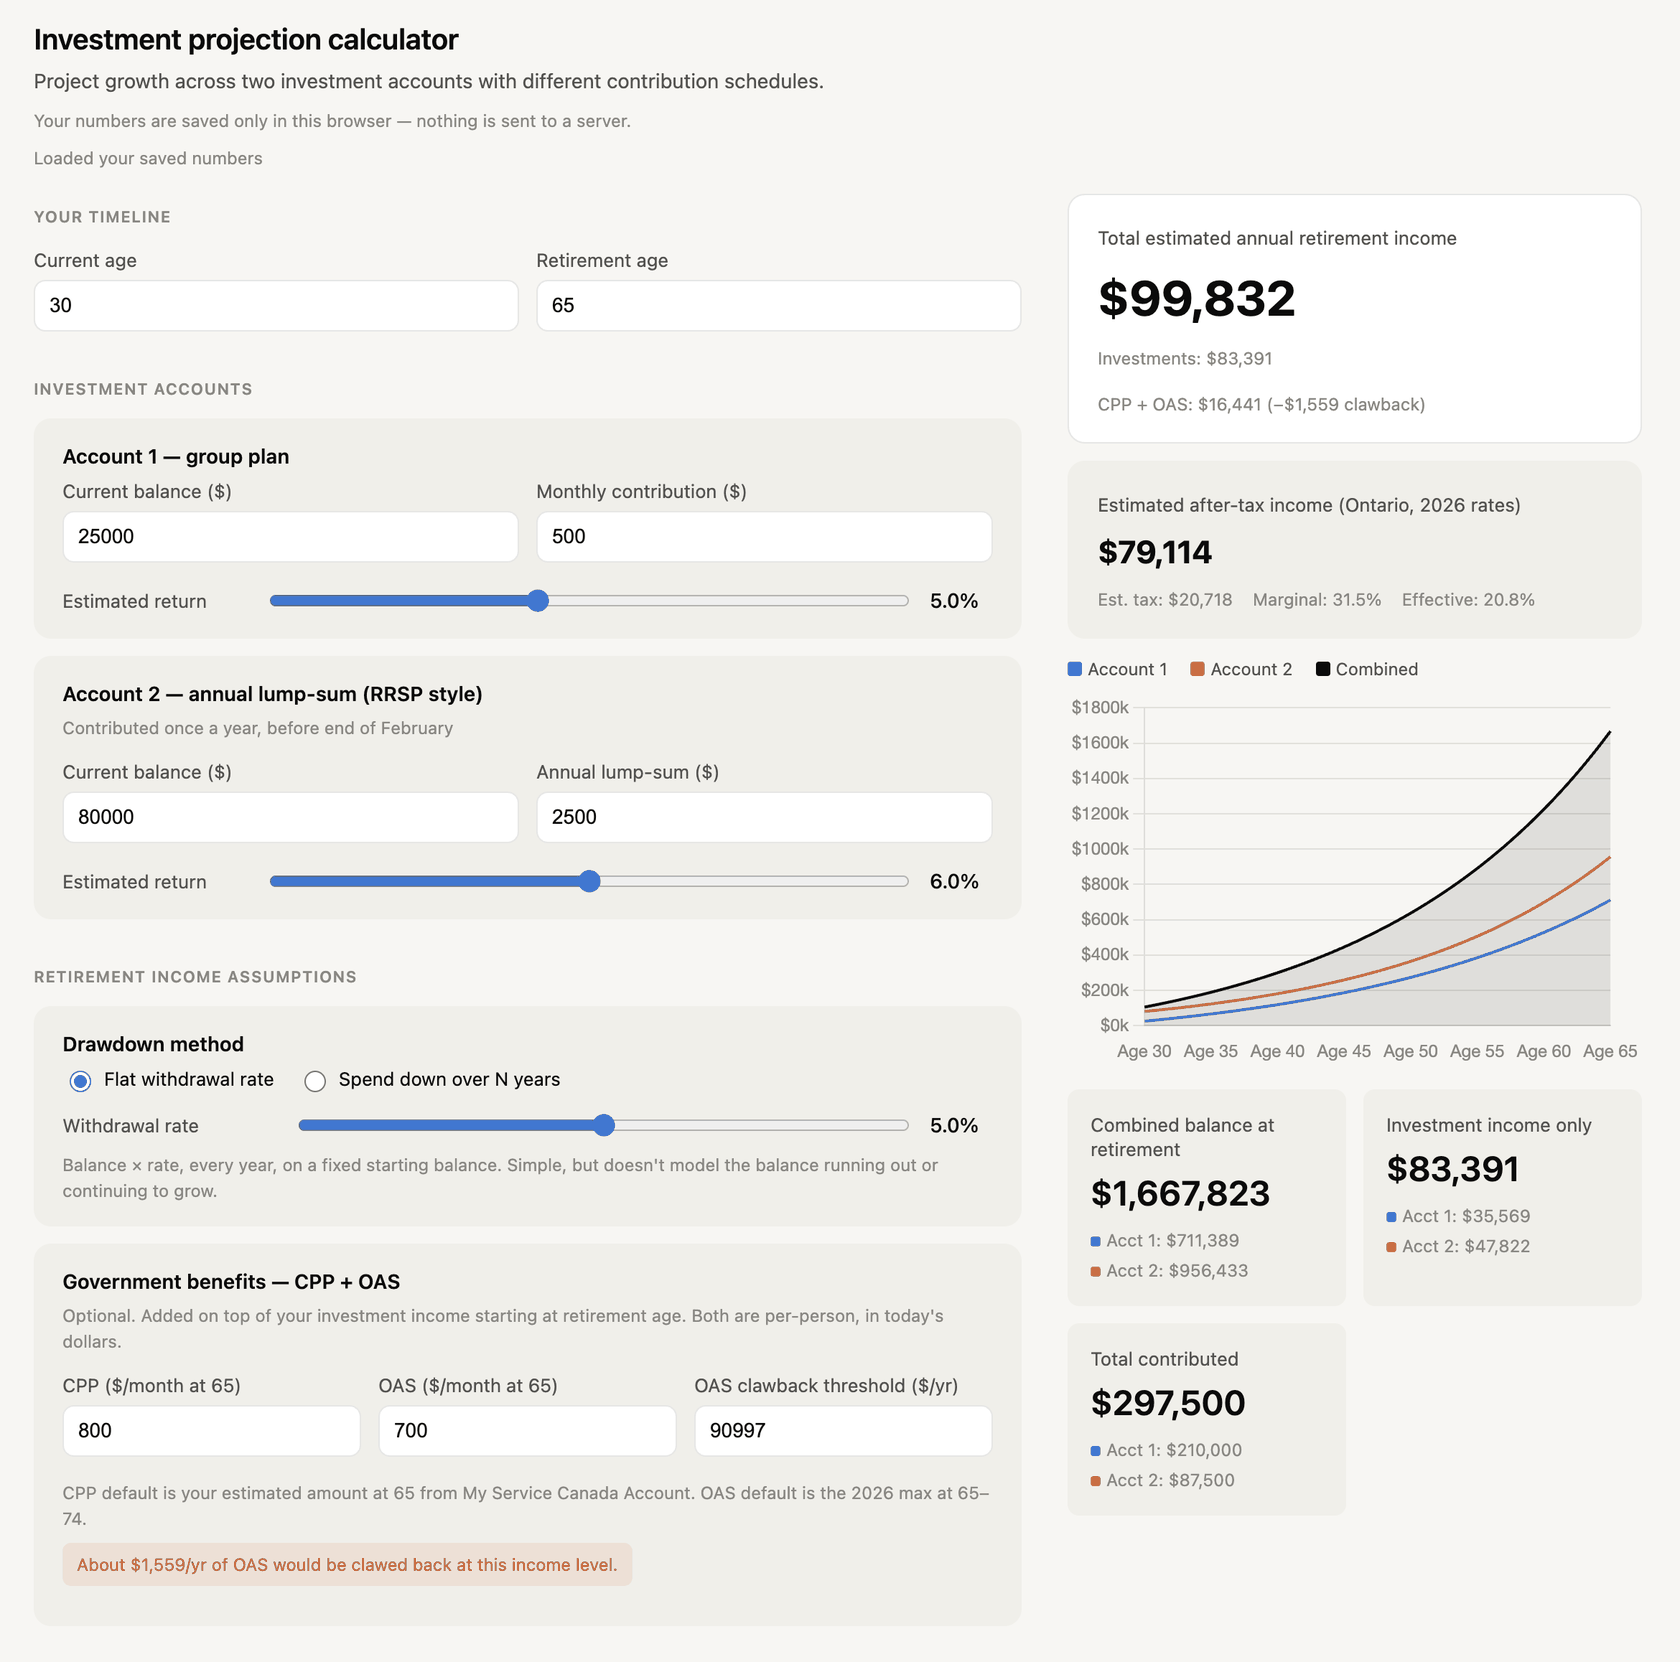
Sliders instead of a static chart.
Adjust rate of return, contributions, and time horizon, and watch the projection update live. It models two accounts independently, then combines them into one retirement income estimate — including a rough CPP/OAS and after-tax figure. On narrow screens the results stay pinned at the top while inputs scroll underneath.
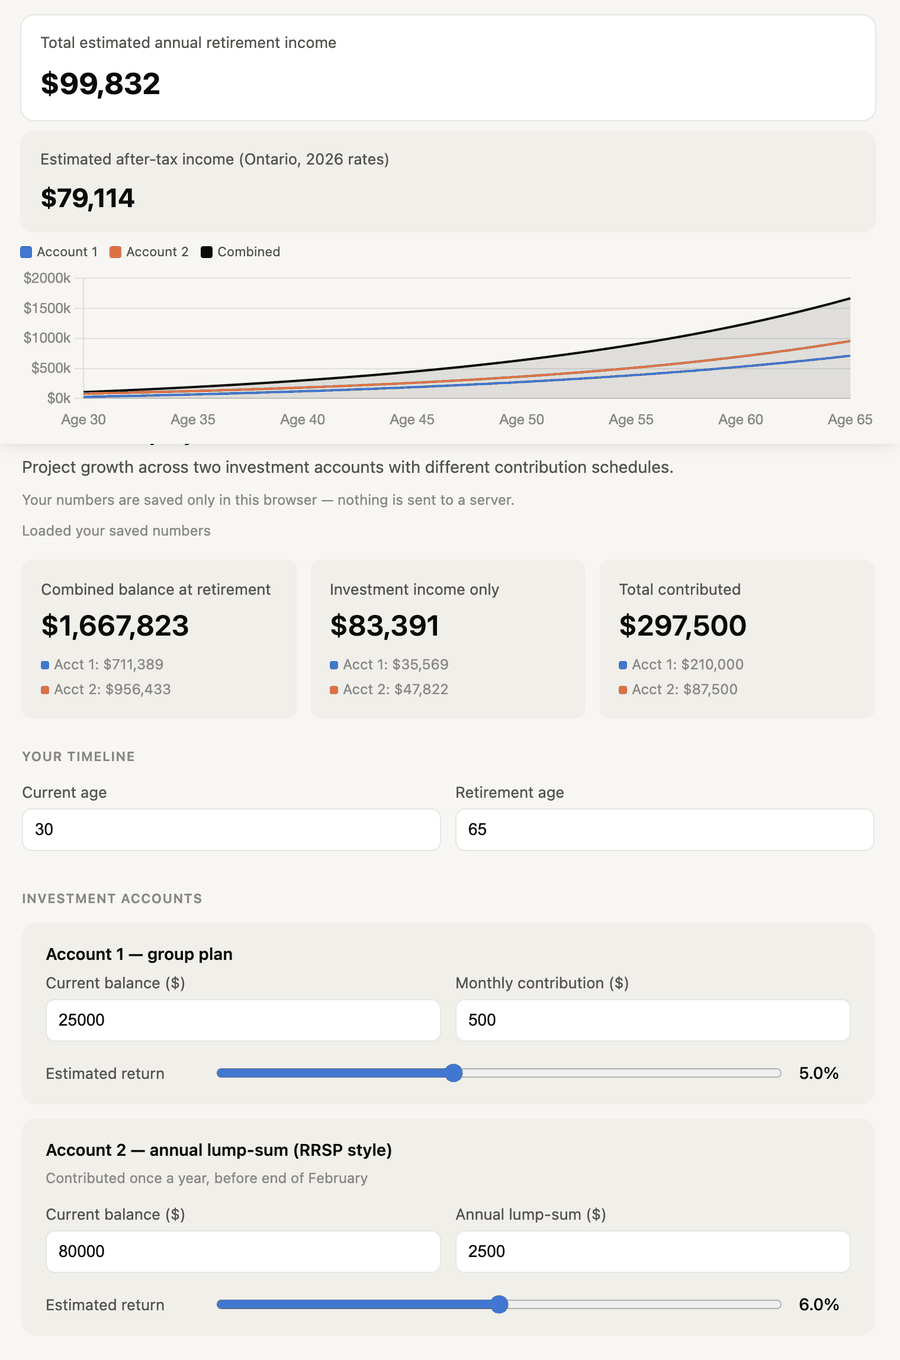
Investment Projection Calculator
A live, interactive tool. Adjust the sliders and inputs to see how your own numbers might play out — everything you enter stays in your browser only.
Open the calculator →Planned and built entirely with AI.
Designed and built directly with Claude, start to finish — concept, interaction design, calculation logic, and interface, with no separate handoff step.
- Claude
- HTML / CSS / JS
- Chart.js
- Browser local storage
A tool I actually use.
Not a demo — a calculator I return to whenever my numbers change. A small project, but proof of a habit I bring to bigger work: when something's opaque, build something that makes it clear.